
CRM and customer dashboards
Configuration, integration and implementation are adapted to the company’s real workflow.
Goatify dashboards help teams visualize customers, sales pipeline, tasks, appointments, campaigns, projects, revenue signals and operational performance.
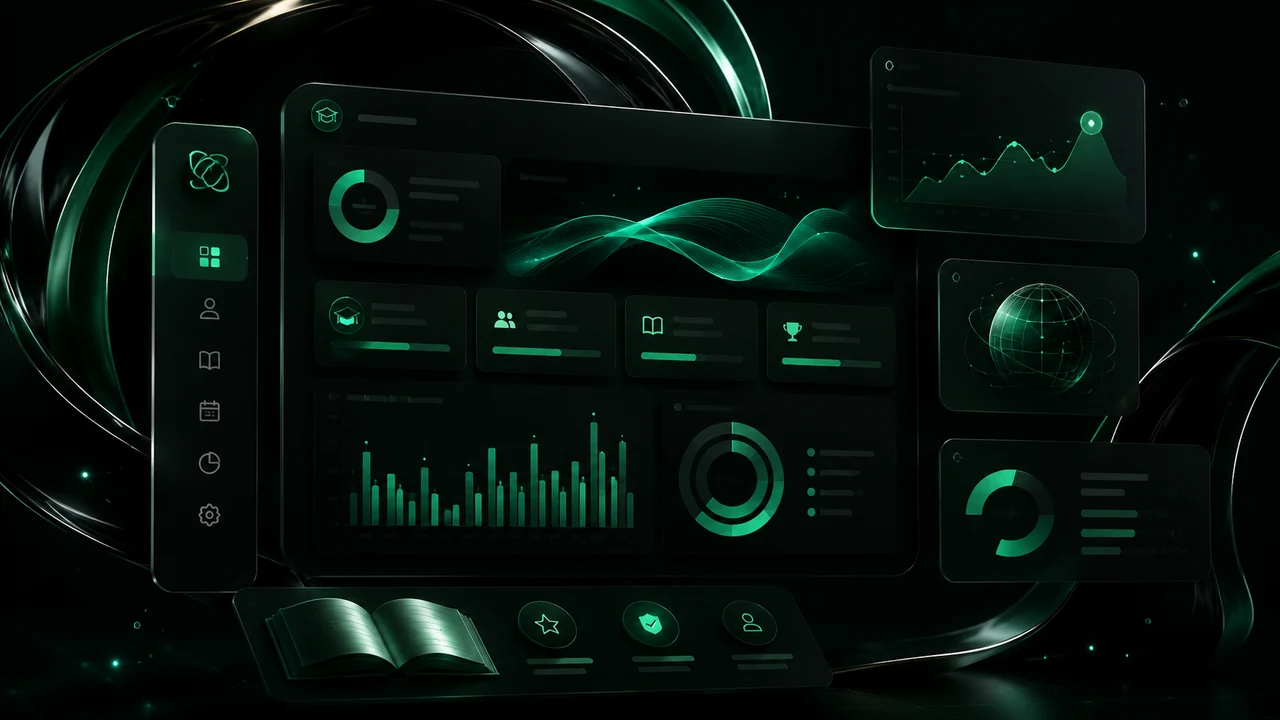
The same platform logic can connect visual presentation, CRM data, AI automation and operational workflows.
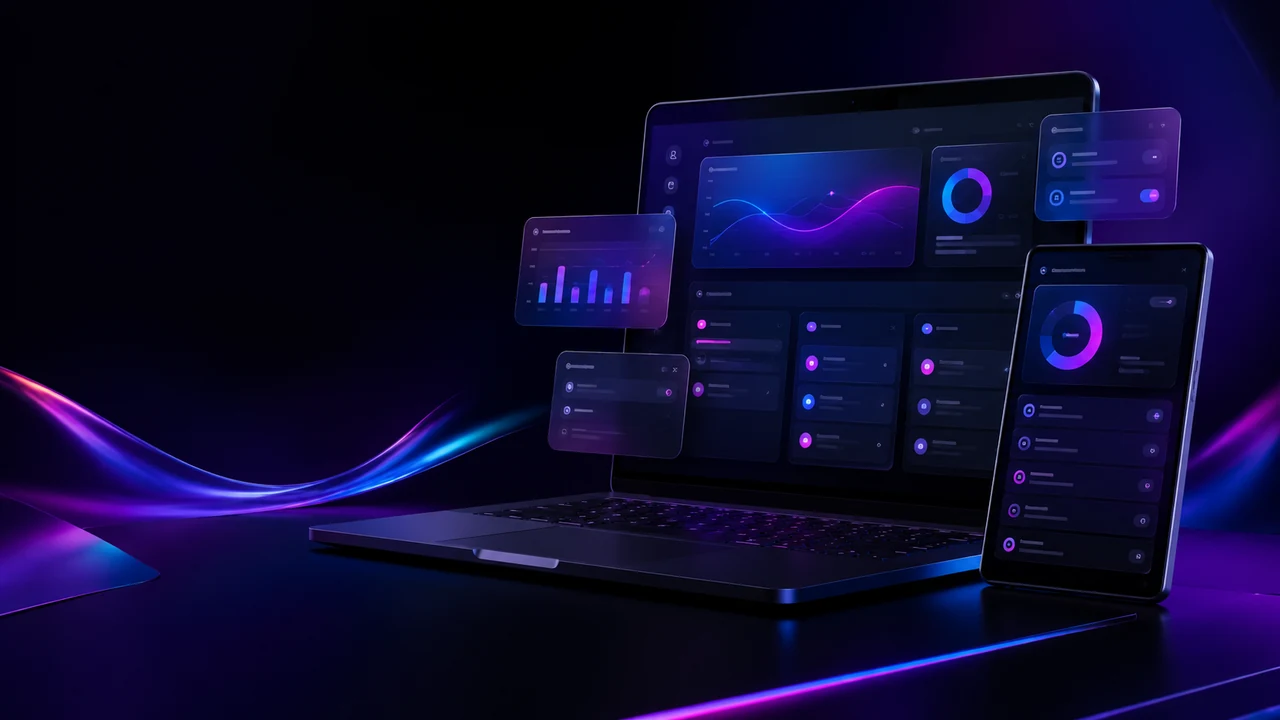

Business dashboards for CRM, sales, tasks, appointments, campaigns, projects, revenue signals and operational performance by Goatify.
Configuration, integration and implementation are adapted to the company’s real workflow.
Configuration, integration and implementation are adapted to the company’s real workflow.
Configuration, integration and implementation are adapted to the company’s real workflow.
Configuration, integration and implementation are adapted to the company’s real workflow.
Configuration, integration and implementation are adapted to the company’s real workflow.
Configuration, integration and implementation are adapted to the company’s real workflow.
A dashboard should not just look good. It should show what needs attention and what is improving.

When CRM, forms, tasks and sales data connect, reports become more accurate.

A clear implementation path reduces risk, aligns teams and keeps the project focused on real business outcomes.
Each phase is reviewed with clear responsibilities and practical acceptance criteria.
Each phase is reviewed with clear responsibilities and practical acceptance criteria.
Each phase is reviewed with clear responsibilities and practical acceptance criteria.
Each phase is reviewed with clear responsibilities and practical acceptance criteria.
CRM activity, sales pipeline, tasks, appointments, campaigns, projects and custom KPIs.
Yes. Views and metrics can be adapted to the business model.
Some dashboards need integrations or structured data sources.
Yes. Pipeline and conversion views can be included.
Dashboards can be designed responsive depending on scope.
CRM, AI agents, websites, apps, portals, productivity and digital growth in one connected company.
Book a working session to define modules, channels, integrations and priorities.
Prices are billed in USD. Local currency values are indicative conversions. Confirm scope, taxes and payment fees in the quote.
Exchange rate reference · 2026-10-04